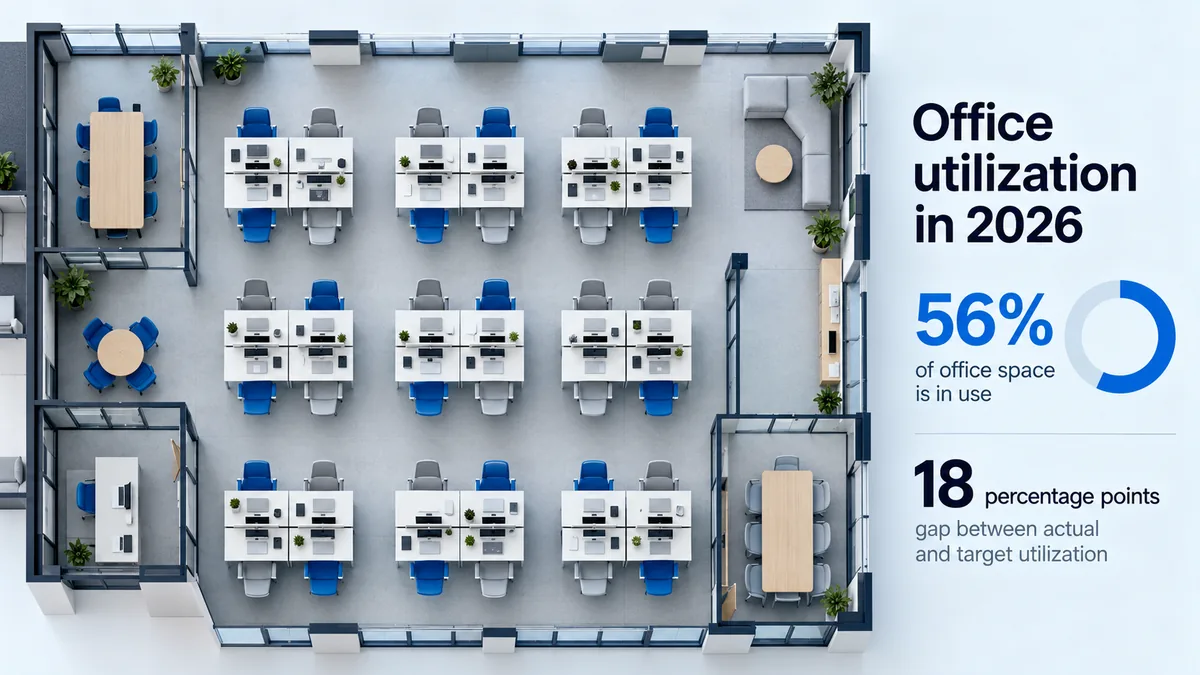
JLL's 2026 Global Occupancy Planning Benchmark Report found that global office utilization reached 56%, up from 54% in 2025, while the gap between actual and target utilization narrowed to 18 percentage points. The improvement reflects both increased workplace use and lower planning targets. Technical spaces recorded 45% utilization against a 72% target, highlighting the importance of evaluating different workspace types separately. For enterprise real estate teams, the findings demonstrate why average utilization alone is insufficient for determining office capacity needs. Peak demand, attendance patterns, space configuration and operational requirements must also inform portfolio planning.
Office utilization reached 56% globally in 2026, according to JLL's latest occupancy planning benchmark. That represents an improvement over the previous two years, but organizations are still using considerably less space than their planning targets anticipate. The gap between actual and target utilization now stands at 18 percentage points. Understanding why that gap persists matters for enterprise real estate teams deciding how much space they need, how it should be configured and whether existing attendance policies are producing the expected results.
How much office space is actually being used in 2026?
JLL's Global Occupancy Planning Benchmark Report 2026, published in May 2026, draws on 84 organizations representing 716 million square feet of real estate across North America, Latin America, Europe, the Middle East, Africa and Asia Pacific.
The report puts global office utilization at 56%, compared with 54% in 2025 and 49% in 2024. Although utilization has increased by seven percentage points over two years, it remains below JLL's reported pre-pandemic benchmark of 61%.
JLL's reported global utilization figures. The 2026 benchmark covers 84 organizations representing 716 million square feet.
The direction of travel is clear: organizations are making greater use of their workplaces than they were two years ago. However, a rising utilization rate does not automatically establish that an office portfolio is appropriately sized.
Utilization measures how available space is used under a particular measurement method. It should not be interpreted as the percentage of employees attending the office, the percentage of leased space occupied by tenants or a direct measure of workplace productivity.
The gap between planned and actual utilization is narrowing
One of the report's most significant findings is that the difference between actual and target utilization has narrowed for the first time since JLL began tracking it.
The gap stood at 25 percentage points in both 2024 and 2025. In 2026, it declined to 18 percentage points.
That seven-point improvement might initially suggest that organizations have substantially increased how efficiently they use their offices. The underlying figures tell a more nuanced story.
JLL reports that actual utilization increased by two percentage points between 2025 and 2026, while target utilization declined by five percentage points. In other words, the gap narrowed partly because organizations adjusted their expectations, not simply because their workplaces became more heavily used.
What was the implied utilization target?
JLL reports actual utilization and the gap between actual and target utilization. Adding these figures provides an implied target.
2025: 54% actual utilization + 25 percentage points = approximately 79% target utilization.
2026: 56% actual utilization + 18 percentage points = approximately 74% target utilization.
These implied targets are BestCoworking calculations based on JLL's published figures. They are approximate because the underlying reported percentages may be rounded.
This distinction matters when evaluating progress against an internal occupancy target.
A workplace can move closer to its target because more people use the available space, because its capacity changes, because the target is revised or through some combination of those factors.
These scenarios have different implications for real estate planning. An organization that increases utilization without changing its footprint may face different operational decisions from one that reaches its target by reducing available space.
Why a utilization gap does not automatically mean excess office space
A utilization figure below 100% does not necessarily indicate that an organization has more space than it needs.
Enterprise workplaces must accommodate variations in attendance, different working patterns and the activities that employees perform throughout the day.
For example, an office may experience relatively low average utilization while facing capacity pressure on particular weekdays. Meeting rooms may be heavily booked even when individual workstations remain available. Specialized teams may also need dedicated environments that cannot be reassigned freely.
Consequently, reducing office space solely because average utilization is below target could create capacity problems at the times when demand is highest.
Before interpreting a utilization gap as an opportunity to reduce the footprint, enterprise real estate teams should distinguish between several measurements:
| Measurement | What it helps establish | What it does not establish by itself |
|---|---|---|
| Average utilization | How intensively available space is used over the measured period. | Whether the workplace can accommodate peak demand. |
| Peak utilization | How much capacity is required during the busiest measured periods. | Whether the same capacity is needed throughout the week. |
| Employee attendance | How frequently employees are present at the workplace. | Which individual spaces they use or for how long. |
| Space-type utilization | How frequently particular environments, such as meeting rooms or workstations, are used. | Whether those spaces meet employees' functional needs. |
| Target utilization | The level of use an organization intends to achieve. | Whether the target is operationally appropriate. |
These measurements answer different questions. Using them together can help distinguish a genuine capacity surplus from uneven demand or a mismatch between workplace design and employee needs.
Technical spaces face a substantially wider utilization gap
JLL's findings also reveal that utilization challenges are not evenly distributed across different types of corporate real estate.
Technical environments, including laboratories, manufacturing facilities, warehouses, data centers and other specialized spaces, operate under different constraints from conventional offices.
Within the technical-space portfolio described in the report, utilization stands at 45%, compared with a target of 72%.
Technical space: a 27-point utilization gap
72% target utilization − 45% actual utilization = 27 percentage points.
This BestCoworking calculation uses JLL's reported technical-space figures. The resulting gap is nine percentage points wider than the 18-point overall office utilization gap.
The two measurements concern different space categories and should be treated as contextual comparisons rather than interchangeable portfolio benchmarks.
JLL reports that 51 accounts manage approximately 110.5 million square feet of technical space within portfolios totaling 486 million square feet. Technical space therefore represents nearly 23% of the managed area in that subset.
That 23% figure should not be interpreted as the proportion of technical space across every organization in JLL's wider 84-organization benchmark.
For specialized environments, utilization is also more difficult to interpret through conventional workplace metrics.
A laboratory may require equipment, safety clearances or controlled conditions that limit how frequently the space can be occupied. A manufacturing facility may operate according to production schedules rather than employee attendance patterns. A data center's operational requirements cannot be assessed using the same assumptions as an office workstation.
These differences mean that a technical-space utilization gap does not necessarily represent capacity that can be eliminated or reassigned.
Enterprise real estate teams need measurement approaches suited to each environment, including equipment use, operational requirements and the consequences of reducing available capacity.
Return-to-office requirements are increasing, but utilization is rising more slowly
JLL's 2026 benchmark shows that hybrid work remains widespread, while organizations are introducing more structured attendance requirements.
Eighty percent of participating organizations operate a hybrid work program, up from 77% in 2025.
Meanwhile, 62% require employees to attend the office for a fixed number of days, compared with 49% in 2025.
The report also indicates that 70% of employees attend the office three to five days per week.
These findings describe a workplace environment in which hybrid arrangements remain common but employee attendance is increasingly governed by defined expectations.
However, the increase in mandatory attendance requirements should not be treated as a direct measure of how efficiently office space is being used.
Attendance requirements and utilization measure different outcomes
The share of organizations requiring fixed in-office days increased by 13 percentage points between 2025 and 2026, while global office utilization increased by two points. These are different measures, and the comparison does not establish that attendance policies caused or failed to cause the observed utilization change.
Higher attendance can create concentrated demand
Employees attending more frequently may still favor the same days or particular workplace environments. Organizations need to examine when and where space is used, rather than assuming that higher attendance translates into evenly distributed demand across the entire office.
For a real estate team, the practical question is not simply whether employees are returning to the office. It is whether the existing workplace configuration matches their actual patterns of use.
An organization could experience increasing attendance while still maintaining more individual workstations than it needs. Alternatively, it could experience pressure on meeting rooms and collaborative spaces without reaching its overall utilization target.
These are different planning problems and may require different responses.
Better occupancy planning depends on better data
JLL's report identifies improving space data accuracy as the second-highest corporate real estate priority in 2026, behind portfolio optimization.
At the same time, organizations are exploring more advanced analytical tools, including AI-assisted occupancy planning.
Only 8% of surveyed organizations have progressed beyond pilot programs to active optimization or scaling of AI in occupancy planning. Privacy concerns are cited as a barrier by 70%, while 73% already have some form of data governance program.
These figures suggest that many organizations are still developing the infrastructure needed to use workplace data consistently.
Before introducing more sophisticated planning tools, enterprise real estate teams need reliable information about available capacity, how spaces are classified, when they are occupied and how utilization is measured.
Inconsistent definitions can produce misleading comparisons. For example, a building-level attendance count cannot establish whether meeting rooms are being used efficiently, and a workstation occupancy measure cannot describe the operational utilization of a laboratory.
Technology can help analyze these differences, but it cannot resolve inconsistent underlying measurements without appropriate data definitions and governance.
How enterprise teams can benchmark their own office footprint
The 56% global utilization figure provides a useful external reference, but it should not become an automatic target for an individual organization.
JLL's benchmark covers large corporate portfolios across multiple regions, with different workplace configurations and operating requirements. A single office, a smaller organization or a specialized facility may have substantially different capacity needs.
A more useful benchmarking exercise starts by establishing the organization's own measurement framework.
1. Define the utilization measure
Identify whether the metric represents occupied workstations, occupied area, building attendance or another measure of space use. Document the measurement period and the capacity used as the denominator.
External benchmarks are meaningful only when the underlying definitions are sufficiently comparable.
2. Compare average use with peak demand
Review how utilization changes throughout the week and across different working hours.
An average can conceal periods when demand approaches available capacity. A workplace with spare capacity on Fridays may still experience shortages on Tuesdays or Wednesdays.
3. Separate different space types
Evaluate individual workstations, meeting rooms, collaborative areas and specialized environments separately where the available data allows.
Combining all space types into a single utilization figure can obscure areas where capacity is insufficient or where demand is consistently low.
4. Examine the target itself
Determine how the existing target was established and whether it reflects current attendance patterns, operational requirements and workplace design.
JLL's 2026 findings show that organizations can narrow their utilization gap partly by revising their targets. A target should therefore be assessed for its operational relevance, not simply retained because it was established in an earlier planning cycle.
5. Connect utilization findings to specific decisions
Different patterns of space use may support different actions.
Consistently low workstation demand could justify examining desk-sharing arrangements or alternative workplace configurations. Concentrated meeting-room demand may point toward changes in the mix of available spaces. Uneven attendance across weekdays may require a closer examination of scheduling patterns.
Where a team needs temporary capacity or wants to test a different office configuration before making a longer-term commitment, flexible workspace may be one option to evaluate alongside changes to the existing portfolio.
Any such decision should account for location, access requirements, operating costs, employee needs and the reliability of the underlying utilization data.
The central finding: utilization targets are changing alongside workplace use
JLL's 2026 benchmark shows measurable progress in global office utilization, but the narrowing gap between actual and planned use cannot be explained by rising occupancy alone.
Actual utilization increased from 54% to 56% over the previous year, while the implied target declined from approximately 79% to 74%. The resulting 18-point gap reflects both developments.
For enterprise real estate teams, the distinction is important. Improving utilization is not simply a matter of bringing more employees into the office or reducing available space until a target is reached.
It requires understanding how different environments are used, when demand is concentrated and whether planning assumptions reflect the organization's actual operating needs.
The most useful outcome of benchmarking is therefore not matching an external percentage. It is developing a more reliable basis for deciding how much space the organization needs and how that space should function.
Methodology, sources and limitations
Primary source: JLL, Global Occupancy Planning Benchmark Report 2026, published May 19, 2026.
Sample: 84 participating organizations representing 716 million square feet of real estate across North America, Latin America, Europe, the Middle East, Africa and Asia Pacific.
Geographic scope: The utilization figures discussed in this article are global benchmarks. The published report does not provide a separate US-only utilization figure.
Historical comparisons: JLL reports global utilization of 49% in 2024, 54% in 2025 and 56% in 2026. The actual-versus-target utilization gap was 25 percentage points in both 2024 and 2025, declining to 18 points in 2026.
BestCoworking calculations: The implied utilization targets of approximately 79% in 2025 and 74% in 2026 are calculated by adding JLL's reported actual utilization to its reported target gap. The technical-space gap of 27 percentage points is calculated by subtracting reported actual utilization of 45% from the reported target of 72%. These are arithmetic calculations based on JLL's published figures, not separately reported JLL estimates.
Technical-space sample: JLL reports that 51 accounts manage approximately 110.5 million square feet of technical space within portfolios totaling 486 million square feet. This is a specific portfolio subset and should not be treated as identical to the wider benchmark sample.
Interpretation: Office utilization, employee attendance, peak capacity requirements and commercial office vacancy are distinct measures. The figures in this article should not be used interchangeably or treated as direct evidence of employee productivity, financial savings or the appropriate office footprint for an individual organization.
Data limitations: The article relies on JLL's published benchmark findings. The underlying organization-level data and full distribution of utilization outcomes are not available in the cited public summary. The benchmark should not be interpreted as a representative census of all US offices.
Source: JLL Global Occupancy Planning Benchmark Report 2026.
Key takeaways
- Global office utilization reached 56% in 2026. JLL's benchmark shows an increase from 54% in 2025 and 49% in 2024, although utilization remains below its reported pre-pandemic level of 61%.
- The utilization gap narrowed to 18 percentage points. The improvement from the 25-point gap recorded in 2025 reflects both higher actual utilization and a reduction in organizations' planning targets.
- Technical spaces face a wider utilization gap. Specialized environments recorded 45% utilization against a 72% target, a difference of 27 percentage points. These spaces require measurement approaches suited to their operational needs.
- Return-to-office requirements are increasing. The share of organizations requiring fixed in-office days rose from 49% in 2025 to 62% in 2026, while 80% of participating organizations reported operating a hybrid work program.
- Average utilization does not establish whether an office has excess capacity. Enterprise real estate teams should also examine peak demand, attendance patterns, space types and operational requirements before making decisions about their office footprint.