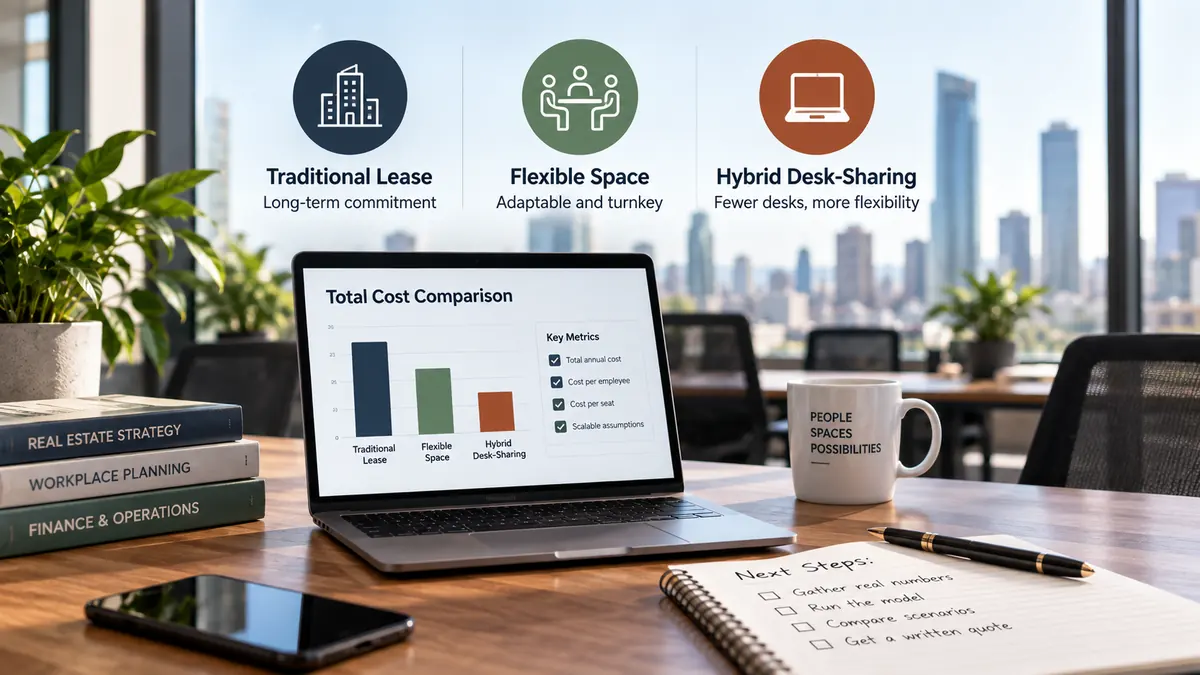
An original, illustrative decision framework for comparing traditional leases, flexible memberships and hybrid desk-sharing. It discloses formulas, hypothetical inputs and limitations; replace them with real quotes and attendance data.
A traditional lease, flexible workspace and hybrid desk-sharing arrangement can have very different cost structures. To compare them consistently, start with your own space requirements, supplier quotes and attendance data rather than a market-average price. This is a cost framework: a set of line items and formulas that turn a lease, a membership or a shared-desk ratio into two comparable figures, cost per employee and cost per seat, plus a worked example showing how the arithmetic behaves as the numbers change.
This is BestCoworking's own original framework, not a market study and not a report on what any real company actually pays for office space. Every dollar amount, headcount and seat count used below to illustrate the model is a hypothetical input, chosen only to show how the math works. Before this tells you anything about your own organization, swap in your actual lease terms, your operator's actual membership quote and your own headcount plan.
What this framework compares
The model compares three structurally different ways an organization can provide workspace for a team of a given size:
- A traditional lease — a direct commercial lease for a fixed amount of square footage, with base rent and operating expenses identified separately where the lease requires it, plus a one-time fit-out and furniture cost the tenant pays or finances upfront.
- Flexible workspace — a coworking or serviced-office membership, modeled here as a recurring per-seat fee with specified operating services included, sized with one seat for each person who needs one.
- Hybrid desk-sharing — the same kind of flexible-workspace membership, but sized for fewer seats than headcount, on the assumption that not everyone is in on the same day.
It compares the dollar cost of housing people, not the qualitative trade-offs of privacy, brand control, collaboration or commute. Those trade-offs matter and belong in the decision, but they don't have a defensible dollar value to plug into a spreadsheet, so this framework leaves them out rather than assign them an invented cost.
The three approaches and their cost line items
Traditional lease
A traditional lease's annual cost has three moving parts. Base rent is quoted per square foot per year and multiplied by however much space the lease covers. Operating expenses, may include CAM (common area maintenance), taxes, insurance or other pass-through charges, depending on the lease. Enter only the expenses not already included in base rent to avoid double-counting. Fit-out and furniture is a one-time upfront cost in this simplified model — build-out, cabling, desks, seating — that this model allocates evenly across the lease term to compare annualized costs. This is a modeling convention, not an accounting treatment or a forecast of annual cash payments.
Put together: annual lease cost = (square footage × base rent per square foot) + (square footage × operating expense per square foot) + (fit-out cost ÷ lease term in years).
Flexible workspace membership
For a real quote, compare coworking and private office listings across the U.S. and ask operators for the exact plan inclusions, term and room charges.
For this model, a flexible-workspace membership uses a recurring per-seat fee. Confirm which services the quoted rate actually includes. The membership fee is usually quoted per seat per month and may bundle services that would be separate line items under a lease. On top of that, some memberships include meeting room hours and may charge for use beyond the allowance, and some operators charge a one-time setup or onboarding fee that's worth amortizing over however long you expect to stay, the same way a lease's fit-out cost gets amortized over its term.
Put together: annual flexible-workspace cost = (seats × monthly membership fee × 12) + annual meeting-room overage cost + (setup fee ÷ expected membership length in years).
Hybrid desk-sharing
Hybrid desk-sharing runs the same formula as a flexible-workspace membership, with one added variable: the number of seats no longer equals headcount. Instead it's driven by a desk-to-headcount ratio — for example, a ratio of one desk for every 1.5 employees assumes roughly a third of the team is elsewhere (working from home, traveling or at a different site) on any given day.
Seat count = round up (headcount ÷ employees per desk) to the next whole seat. For example, 100 ÷ 1.5 = 66.67, so the model budgets for 67 seats. That seat count feeds into the same membership-cost formula as flexible workspace, though the meeting-room and overflow line item usually needs to be higher, since a tighter ratio increases the odds of scheduling collisions and occasional overflow days that need extra day passes or rooms.
The ratio itself should be checked against observed seat utilization — occupied seats ÷ available seats on a given day; evaluate peak days as well as typical days, measured from badge-swipe or desk-booking data if you already operate a shared model, or estimated conservatively from attendance patterns if you don't yet. A ratio that looks efficient on paper but does not accommodate your peak attendance shows up later as overflow costs or employees hunting for a desk, not as a line item the model captures automatically.
How the pieces combine
Once each approach's line items are estimated, the structure is the same for all three: add the line items into one total annual cost, then divide that total two different ways to get two different answers.
The two calculations: cost per employee and cost per seat
The framework produces two numbers, and they answer different questions.
Cost per employee = total annual cost ÷ headcount. This is the number to compare against your own budget per head, and it's the fairest comparison across approaches because headcount doesn't change just because you picked a different workspace strategy.
Cost per seat = total annual cost ÷ seat count. This is the number that tells you how hard each seat is working. In the illustrative traditional-lease and 1-to-1 membership scenarios below, seat count equals headcount, so the two figures are identical; real leases may provide a different number of usable seats. For hybrid desk-sharing, seat count is smaller than headcount by definition, so cost per seat rises even as cost per employee falls — that difference follows from the smaller denominator, not from measured occupancy.
An illustrative scenario: a hypothetical 100-person team
To see the formulas in motion, here's a fully hypothetical team of 100 employees, priced with invented inputs chosen only to demonstrate the arithmetic. None of the rent, membership or fit-out figures below reflect any real market, city or operator — replace every number with your own before using this for an actual decision.
Illustrative inputs used in this scenario: 150 square feet per employee, $40 per square foot base rent, $14 per square foot operating expenses, $90 per square foot fit-out cost amortized over a 7-year lease term, a $700 per seat monthly flexible-workspace membership fee, a $25,000 one-time setup fee amortized over 3 years and a 1-to-1.5 desk-to-headcount ratio for the hybrid option. Displayed dollar figures are rounded to the nearest dollar after calculations using unrounded values. This simple model assumes the same 100 employees across all three approaches, 15,000 leased square feet, 100 usable seats under the lease, and the same $25,000 setup fee for both membership options. It is not a cash-flow comparison.
| Line item (hypothetical, annual) | Traditional lease | Flexible workspace | Hybrid desk-sharing |
|---|---|---|---|
| Seats needed | 100 | 100 | 67 |
| Base rent or membership fee | $600,000 | $840,000 | $562,800 |
| Operating expenses / CAM | $210,000 | Included in membership fee | Included in membership fee |
| Fit-out & furniture, amortized | $192,857 | — | — |
| Meeting room / overflow costs | — | $18,000 | $32,000 |
| Setup fee, amortized | — | $8,333 | $8,333 |
| Total annual cost | $1,002,857 | $866,333 | $603,133 |
| Cost per employee (÷100 headcount) | $10,029 | $8,663 | $6,031 |
| Cost per seat | $10,029 | $8,663 | $9,002 |
With these hypothetical inputs, hybrid desk-sharing has the lowest modeled cost per employee. Its cost per seat is higher than the 1-to-1 flexible membership because 67 seats serve 100 employees and the assumed meeting-room and overflow cost is higher. This result is specific to the invented inputs, not a prediction for a real organization. Change the desk-to-headcount ratio, the membership rate or the overflow assumption and both figures move; that sensitivity is what the next table walks through.
Sensitivity: what happens when the desk-sharing ratio changes
Holding headcount at the same hypothetical 100 employees and the membership rate at the same hypothetical $700 per seat, here's how tightening the desk-to-headcount ratio moves both output figures for the hybrid approach. All three rows also include the same hypothetical $8,333 amortized setup fee used above, folded into the total but not shown as a separate column. The meeting-room/overflow line item is assumed to rise as the ratio tightens, reflecting more scheduling collisions and occasional day-pass overflow — that assumption is also invented for this illustration and should be replaced with whatever your own operator quotes for overflow access. Note that the 1-to-1.0 row here isn't the same as the "Flexible workspace" column above — it's a hybrid-labeled membership at a 1-to-1 ratio, priced with this section's own overflow assumption, so the ratio's effect can be isolated on its own.
| Desk-to-headcount ratio | Seats needed (100 employees) | Membership fee (annual) | Meeting room / overflow costs (annual) | Total annual cost | Cost per employee | Cost per seat |
|---|---|---|---|---|---|---|
| 1-to-1.0 | 100 | $840,000 | $10,000 | $858,333 | $8,583 | $8,583 |
| 1-to-1.3 | 77 | $646,800 | $22,000 | $677,133 | $6,771 | $8,794 |
| 1-to-1.5 | 67 | $562,800 | $32,000 | $603,133 | $6,031 | $9,002 |
The highlighted row matches the hybrid column in the scenario table above. Reading across, cost per employee falls while cost per seat rises under these assumed inputs. Neither measure reveals how many desks are available on a peak attendance day. Use observed daily occupancy, peak attendance and actual overflow charges to test whether the proposed seat count is workable.
The gap between cost per employee and cost per seat reflects the different denominators. It is not an occupancy measure or proof of savings. Check peak-day attendance, desk availability and actual overflow costs before relying on the hybrid scenario's modeled annual total.
Headcount changes move the three approaches differently, and that's often the bigger risk than the ratio itself. A traditional lease's total cost is fixed for the term regardless of how many people actually show up, so cost per employee rises if headcount shrinks and falls if it grows — the lease doesn't know headcount changed. A flexible or hybrid membership may allow seat counts to change at renewal, subject to the agreement and availability. Model the notice period, minimum commitment and any repricing before assuming costs will move in step with headcount.
What this model doesn't account for
Treat this as a cost comparison, not a full decision. It doesn't put a dollar value on privacy, brand control, collaboration quality, commute time or the disruption of a move, and it shouldn't — those trade-offs are real but assigning them an invented dollar figure would be worse than leaving them out. It is an annualized comparison, not a cash-flow forecast, net-present-value analysis or accounting treatment. It also omits any lease incentives, rent escalations, security deposits, utilities, cleaning, insurance, IT, moving costs, taxes, vacancy and exit costs unless you add them as separate, nonduplicated inputs. Ask your finance and legal teams to review the actual agreements and the timing of payments. Every output is only as reliable as the inputs — a wrong rent quote or an optimistic desk ratio produces a wrong answer just as confidently as a right one.
Turning this into your own comparison
To run this for your own team, you need real inputs rather than the hypothetical ones used above: an actual rent quote broken into base rent and operating expenses, an actual fit-out estimate and the usable seat count, an actual membership quote (including meeting-room allotment and overage rate) from one or more flexible-workspace operators, your realistic headcount plan over the term you're evaluating and, if you already run any shared-desk model, daily attendance and peak utilization data rather than an assumed ratio. Use the same time horizon for each option, add missing costs and compare cash-flow timing separately if it matters to your decision.
If you want live membership numbers to test in the flexible-space and hybrid columns, you can browse coworking spaces, private offices and meeting rooms across the US on BestCoworking's U.S. workspace directory and contact operators directly for a written quote. BestCoworking doesn't book space or guarantee availability, but a real quote is what turns this from an exercise into a number finance can actually use.